Log Drain Examples
Detailed instructions on how to use drains with third party log analysis software or services:
Note
Do not forward both application and system logs to the same destination.
Papertrail
- Create an account for Papertrail
- On the Dashboard screen, click Add Systems.

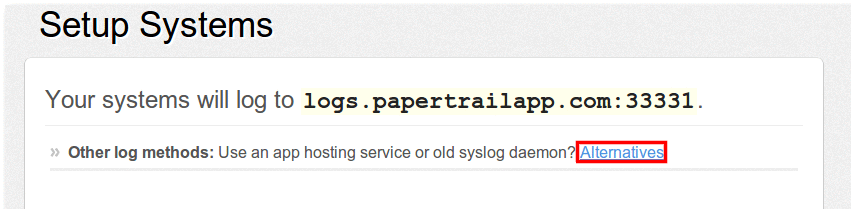
- On the Setup Systems screen, under Other log methods, click Alternatives.
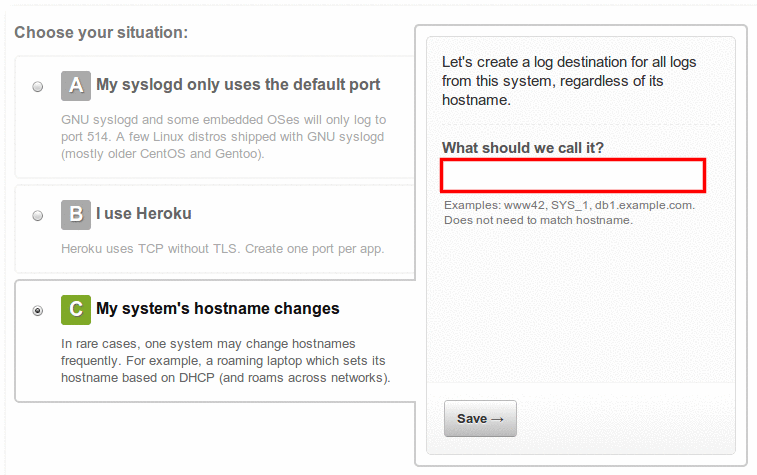
- Click option C, My system's hostname changes and name the system.
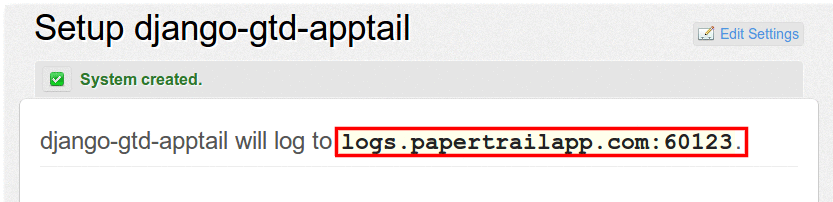
- Note the port number.
Enable system logging (via UDP) by executing the following kato command:
$ kato log drain add <drain-name> udp://logs.papertrailapp.com:<port>
Note
Papertrail requires systail log lines to have <13>l at the
beginning of each line. Make sure the drain you are forwarding is
formatted this way. For an example, see Saving Custom Log Formats.
Splunk
- Setup Splunk Server.
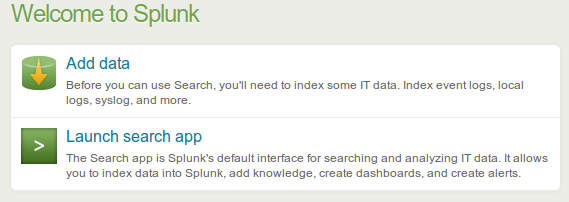
- On the Welcome screen, click Add data.
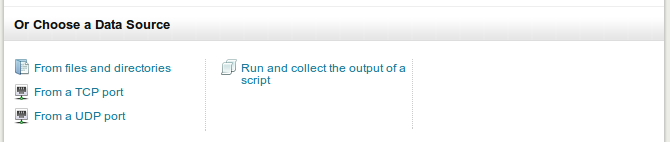
- Under Choose a Data Source, click From a TCP port (UDP is also available.)
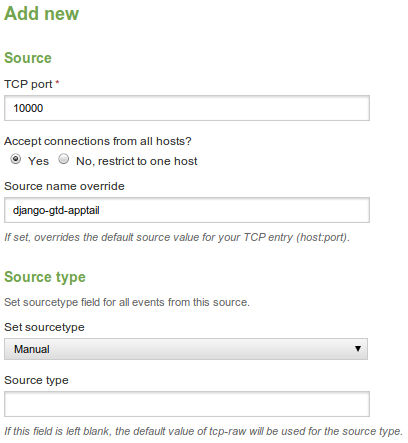
- On the Add New Source screen:
- Select a TCP/UDP port greater than 9999
- Enter a Source name.
- Set sourcetype to Manual
- Leave Source Type empty.
On the Helion Stackato core node, create a system log drain with one of the following commands.
For a UDP drain:
$ kato log drain add <drain-name> udp://<splunk-server-address>:<port>
To create a TCP log drain:
$ kato log drain add <drain-name> tcp://<splunk-server-address>:<port>
Splunk supports logs in JSON format which can be enabled in the log drain with the
--format jsonoption:$ kato log drain add --format json <drain-name> tcp://<splunk-server-address>:<port>
Logstash
Configure Logstash to add a UDP or TCP listener on the port of your choosing. For example, for a UDP listener on port 10000, add the following to the logstash.conf:
input {
   udp {
      port => '10000'
   }
}
Enable system logging (via udp) by executing the following kato command:
$ kato log drain add <drain-name> udp://<logstash-server-address>:<port>
Hello World Custom Drain
The command below starts a drain target server on a node, piping to a local file:
$ nc -lk 0.0.0.0 10000 > log-output.txt
As long as that nc command runs, this will funnel logs from all drains targeting
it into the file log-output.txt
Enable system logging by executing the following kato command:
$ kato log drain add <drain-name> udp://<server-address>:<port>
or:
$ kato log drain add <drain-name> tcp://<server-address>:<port>