Application Logs
Logs for applications running on Helion Stackato are aggregated into streams, so that data from multiple instances can be viewed together and filtered. You can access application log streams in a variety of ways:
- on the application Details page of the Management Console, click View Logs
- run the stackato logs command
- use application log drains
Log streams are tailed output from actual log files in each application
container, generally found in the /home/stackato/logs/ directory. These files
can be accessed with the stackato files command or
from the Application details page of the Management Console.
Note
These files are not automatically rotated. For long-running applications or verbose logs, you should rotate them to avoid filling up the application container's filesystem.
stackato logs
To view an application log stream, run the stackato logs command:
$ stackato logs myapp
To limit the number of lines displayed, use the --num option:
$ stackato logs myapp --num 50
To view a log stream as it is updated, use the --follow (or -f) option:
$ stackato logs myapp -f
Log streams can be filtered on a number of parameters:
--textdoes a glob pattern match on the log message--instanceshows only logs from the specified application instances (starting at instance0).--filenamefilters based on the log filename (for example,stderr.log)--sourceshows only logs from the specified source (apporstaging). Without a source specified, the log stream includes staging and application logs as well as cloud events relevant to app.
The --json flag can be used to return each log line as a JSON object.
Note
stackato logs buffers only 400 lines of the log stream history
and may sometimes miss log lines if the output is higher than the
system's application log rate limit (set by a Helion Stackato
administrator). If you need earlier log lines, or find that lines
are missing, run the stackato files command
to fetch the relevant log file from the logs/ directory or create
a log drain preemptively (where
possible).
Adding Files to the Stream
Important
To be monitored, the log file must already exist when the application is started, either in application code or as a result of being created by a buildpack, a pre-staging hook, or a post-staging hook.
By default, the stackato logs command streams log data from staging_tasks.log
while staging and from stdout.log and stderr.log while running.
You can add up to five additional files to the log stream by modifying the
STACKATO_LOG_FILES environment variable (in manifest.yml or using stackato set-env).
The variable should contain a list of named files separated with a colon
(:) in the following format:
name=/path/to/file.log:name=/path/to/another.log
The name that you use in the value or the individual variable name becomes part of each log line. You can use it to filter the stream.
For example, to add a specific Tomcat log file to the default
$STACKATO_LOG_FILES variable, set the env: key in manifest.yml
as follows:
env:
  STACKATO_LOG_FILES: tomcat=/home/stackato/tomcat/logs/catalina.2013-11-04.log:$STACKATO_LOG_FILES
You can specify paths in full or relative to $STACKATO_APP_ROOT.
stackato drain
The stackato drain add command is used to create a log drain which forwards application logs to external log aggregation services, log analysis tools, or Redis databases. For example:
$ stackato drain add myapp appdrain udp://logs.papertrailapp.com:12345
This creates a UDP drain called appdrain for the application myapp
which forwards all log messages and events for that application to
Papertrail on port 12345.
The log drain URL can contain only:
scheme:udp://ortcp://host: IP address or hostnameport: A number
Any additional parameters are discarded.
To delete the drain:
$ stackato drain delete appdrain
Use the --json option send the log lines in JSON format:
$ stackato drain add myapp jsondrain --json udp://logs.papertrailapp.com:12346
To check the status of your application drains, use the stackato drain
list command.
Note
If the service at the receiving end of the drain goes offline or becomes disconnected, Helion Stackato will retry the connection at increasing intervals.
Log Drain Examples
Detailed instructions on how to use drains with third party log analysis software or services:
Papertrail
- Create an account for Papertrail
- In the Dashboard screen, click Add Systems.

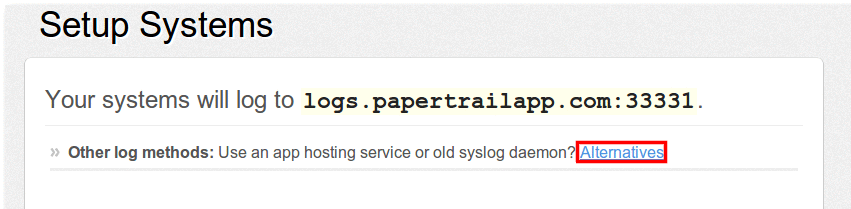
- In the Setup Systems screen under Other log methods, click Alternatives.
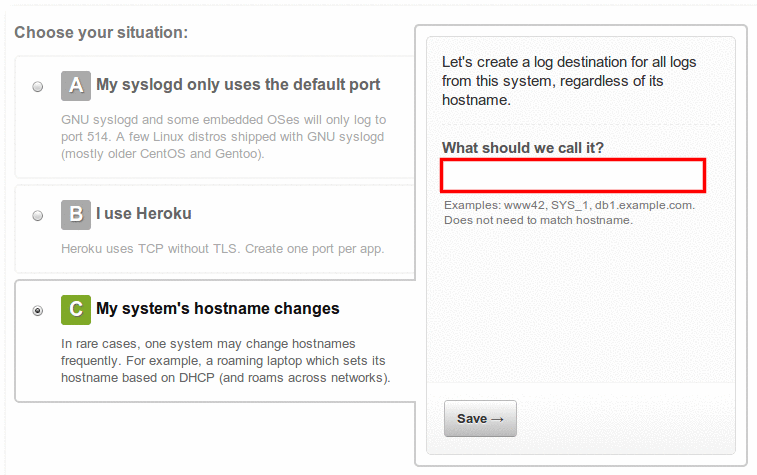
- Choose option C: My system's hostname changes and give it a suitable name.
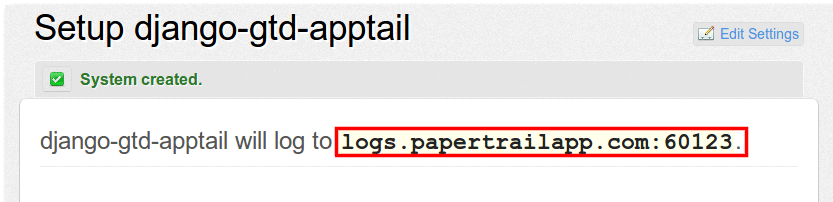
- Note the port number.
Enable application logging (via udp) by executing the following client command:
stackato drain add <drain-name> udp://logs.papertrailapp.com:<port>
Splunk
- Setup Splunk Server.
- On the welcome screen, click Add data.
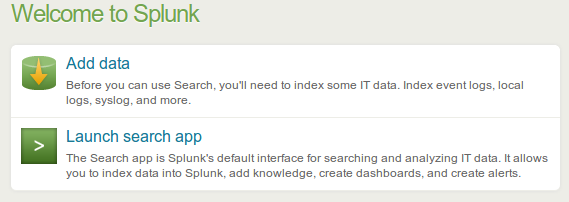
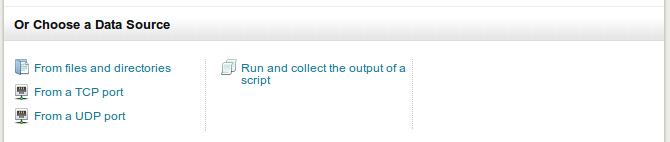
- Under *Choose a Data Source, click From a TCP port (you can also choose a UDP port).
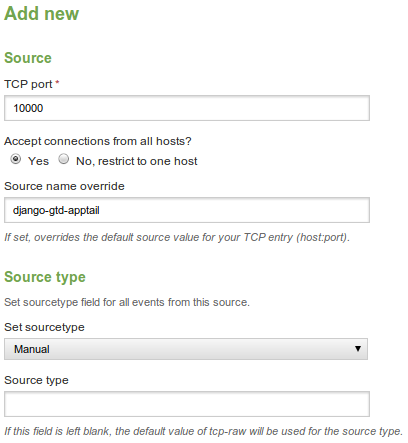
- In the Add new Source screen:
- Select a TCP/UDP port greater than 9999.
- Enter a Source name.
- Set sourcetype to Manual.
- Leave Source Type empty.
Run the following client command to create the log drain:
stackato drain add <drain-name> udp://<splunk-server-address>:<port>
or:
stackato drain add <drain-name> tcp://<splunk-server-address>:<port>
Splunk supports JSON format without further configuration.
Hello World Custom Drain
The command below starts a drain target server on a node, piping to a local file:
nc -lk 0.0.0.0 10000 > log-output.txt
As long as that nc command runs, this will funnel logs from all drains targeting
it into the file log-output.txt
Run the following client command to create the log drain:
stackato drain add <drain-name> udp://<server-address>:<port>
or:
stackato drain add <drain-name> tcp://<server-address>:<port>
Rotating Application Log Files
Helion Stackato does not automatically rotate application log files in
/home/stackato/logs/. However, you can add log rotation for these files yourself
using cron and logrotate:
Add a cron key to
manifest.ymlto runlogrotate. SetSTACKATO_CRON_INSTANCEStoallto specify that the job should be run in all application instances. For example:env: STACKATO_CRON_INSTANCES: all cron: - 0 1 * * * /usr/sbin/logrotate --state /home/stackato/app/logrotate-state /home/stackato/app/app-logrotate.conf
The
--stateoption must be set because thestackatouser does not have permission to update the default state file.Add an
app-logrotate.conffile to the root directory of your application to specify which log files to rotate, and and whichlogrotateoptions to use. For example:/home/stackato/logs/\*.log { daily compress copytruncate dateext missingok notifempty rotate 3 maxage 7 size 3M }
Programming languages, frameworks, and utilities handle logging
operations in different ways. Check for incompatibilities with
logrotate before implementing log rotation scheme such as the one
above.